I recently had the privilege to play with some new Xeon Platinum 8160 chips at UTS before they went into production – thanks to Dr Matt Gaston for the support on this one. The main idea for this test of OpenFOAM was to verify the performance of Sub NUMA Clustering (SNC) on Dell 14th Generation PowerEdge Servers running with “SkyLake” chips, which indicated a performance increase in the order of two percent with SNC enabled. These tests were based on the standard OpenFOAM motor bike example but pushed out to 24M cells. In fact, this is the first of three posts based on some new hardware that I was able test.
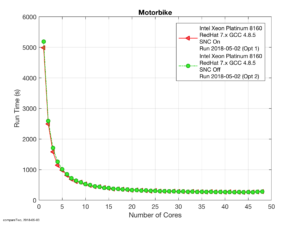
Looking first at raw runtimes SNC on appears faster, at least at low core counts, as shown in Figure 1. However, for core counts greater than ten the time differences are too small to accurately see on that figure.
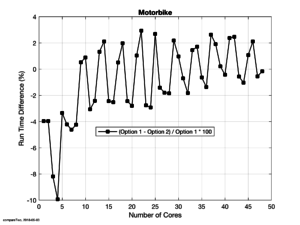
Looking at the higher core counts, though, the simplistic assumption of a uniform 2% performance increase across all core counts is invalid, as shown in Figure 2. For 28 of the 48 cores the runs are faster and, visually at least, in the order of 2% faster. Unfortunately, though for the remaining 20 core counts the run times with SNC on are actually slower than the reference and, again, in the region of 2%.
There appears to be a distinct saw-tooth pattern in the runtimes, but I don’t have an explanation for that at this stage. We’d considered processor layout issues but would expect an odd/even swap as the core count increased. Anecdotally, I believe that even allocations are usually faster than odd core counts but the present data does not follow that axiom either. Alternatively, there may be an uneven fill of the memory channels but, as before, that is not supported with the progression that is observed.
The final comparison that is usually made at this juncture is a comparison of scale out behaviour of the benchmark as the core count is increased. First, as with other OpenFOAM benchmarks I’ve played with in the office on high-core count machines, OpenFOAM scales at pretty much linear for the first few cores, as shown in Figure 3. In this benchmark the linear region reaches nearly out to nearly ten cores. Beyond ten cores, the results are counterintuitive and need to be examined with some care because on first glance the SNC Off tests appear to scale out better than the SNC on baseline.
In this case the answer is, with reference to Figure 1, that the SNC off simulations do scale better than SNC on but the reference value of the one core simulation is significantly higher to start with. Hence, a similar reduction in runtime relative to such a high start will give the appearance of a better scale out performance when in fact the SNC on simulations are faster to begin with and continue to be, mostly, faster as the core count increases.
On balance, my thought is that SNC on is a better option as for most of the core counts tested we did achieve at least the suggested 2% performance increase. Unfortunately, that does come with a caveat that for some 40% of the time there may actually be a performance hit that I will have to sacrifice.
Finally, thanks for reading this article and please leave a comment below. If you are interested in being updated when similar items are posted then either subscribe via RSS or sign up to my mailing list below.


2 comments On Sub NUMA Node Clustering on Xeon Platinum 8160
Pingback: First OpenFOAM Tests On An EPYC 7551P – Open Fluids ()
Pingback: Xeon Platinum 8160 Verses EPYC 7551P – Open Fluids ()
Comments are closed.